The easiest way to skyrocket your YouTube subscribers

Linear Control Systems: How to draw Bode plot using semilog sheet: Solved Example to find GM and PM

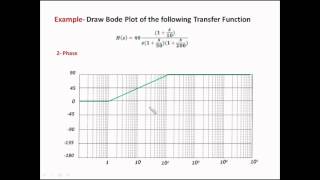
This video illustrates the steps to draw Bode plot for a given Transfer Function and also explains how to find Gain Margin (GM) and Phase Margin (PM) and comment on the stability of the system.
Pls note that this video illustrates the straight line approximation of the bode plot.


Recommended