Linear Regression Made Easy! The Epic Full Story with all Details. Excel Statistical Analysis 50

Download Excel File: https://excelisfun.net/files/Ch14ESA... Download 2 PDF note files: https://excelisfun.net/files/Ch14ESA..., Download Deductive Proof 1 PDF: https://excelisfun.net/files/Linear%2... Download Deductive Proof 2 PDF (short version): https://excelisfun.net/files/Linear%2...
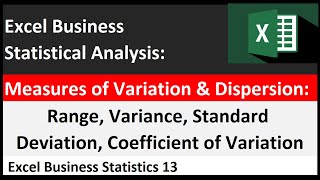
Learn about the 12 important calculations for Linear Regression: Covariance, Correlation, Slope, Y Intercept, Sum of Squares Total = SST, Sum of Squares Regression = SSR, Sum of Squares Error (Residual) = SSE, R Squared = Coefficient of Determination, Mean Square Error, Standard Error of Estimate, pvalue for F. See many diagrams, pictures and animations to help make the complicated math easy to understand.
Learn about the Excel functions: FORECAST.LINEAR, COVARIANCE.S, PEARSON, CORREL, SLOPE, INTERCEPT, SUMSQ, RSQ, STEYX and more.
Topics:
1. (00:00) Introduction
2. (00:27) Outline for topics
3. (02:47) X and Y Data Sets. Regression shows correlation, not causation.
4. (03:36) XY Scatter Chart
5. (05:00) Types of Relationships
6. (06:18) Add Ybar and Xbar Lines to XY Scatter Chart
7. (11:17) Sample Covariance. Why the formula is cool
8. (11:17) How to make sense of the Linear Regression Formulas, in a visual way
9. (14:17) Calculate Sample Covariance
10. (18:24) Calculate Coefficient of Correlation
11. (19:19) Calculate Sample Standard Deviation
12. (22:06) Simple Linear Regression Estimated Equation: Population Parameters and Sample Statistics.
13. (25:20) Assumptions to use Estimated Equation to predictions won’t be too high or too low
14. (30:35) Look at formulas for Slope and YIntercept. Look at Least Squares Method, including Deductive Proof
15. (32:10) Calculate Slope
16. (33:20) Calculate Y Intercept
17. (35:05) Use formula to create algebra/statistics formulas. Learn about the FIXED function.
18. (36:42) Experimental Range
19. (37:20) Make prediction with estimated equation
20. (37:50) Add equation to chart
21. (38:17) Understanding SST = SSR + SSE and R Square.
22. (39:06) What are Residuals?
23. (42:05) Great Visuals for Residuals and SST + SSR + SSR and R Squared
24. (50:17) Calculate SST, SSR and SSE
25. (54:40) Calculate R Squared = Coefficient of Determination
26. (56:12) Calculate Mean Square Error = MSE
27. (57:12) Calculate Standard Error of Estimate (y) = s
28. (58:05) Calculate Mean Square Regression = MSR, F Test Statistic and pvalue to test reasonableness of relationship
29. (01:00:31) Understanding Residual Plot to Test Regression Assumptions
30. (01:04:52) Build Residual Plot
31. (01:05:02) FORECAST function
32. (01:07:02) Data Analysis Regression Tool
33. (01:11:20) Summary of video
34. (01:11:55) Closing, Next Video and Video Links