Map and Filled Map visualization - Power BI Report

Welcome to Edudream digital,
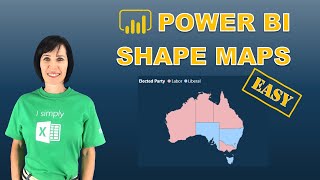
In this lesson learn about creating Map and Filled Map chart Visualization in power BI.
#edudreamdigital #powerbi #powerbitutorials #mapchart #visualization
Dataset used: https://github.com/golhersavita/power...
Follow more videos:
• Power BI tutorial : Slicers Vs Filt...
• Color formatting and Axis Properties ...
• Power BI DAX Date and Time function...
===================================================
⭐ Find me on other Social Media
LinkedIn: / savitagolher
Github: https://github.com/golhersavita
Instagram: / savitahatwar_303
Facebook: / savita.hatwar
=================================================
Thank you for watching
=================================================