Master Containers: Build an Interactive Tableau Dashboard From Scratch

In this video you will learn stepbystep how to create an interactive Tableau dashboard.
We'll start with a 2 datasets:
1. Beverage sales
2. Custom shape for US states
I will show you how relationships work in Tableau to combine these two datasets.
Once we create the data set, we'll build all of the charts we need, create a parameter, and apply the filters.
We’ll create:
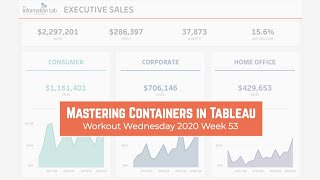
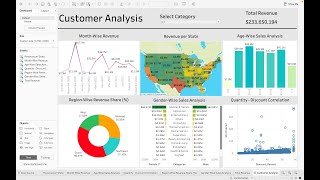
1. Summary key figures (KPIs)
2. A custom map of the US
3. A monthly breakdown as a line chart
4. Two bar charts for products and customers
Lastly, we'll make the dashboard dynamic and interactive using different filter types and a parameter and make sure everything updates automatically.
As a bonus, you’ll learn a lot about working with containers in Tableau.
Data https://data.world/vizwiz/samplesoda...
US Albers Map Projection https://data.world/vizwiz/usalberse...
Workbook https://www.vizwiz.com/2023/10/intera...