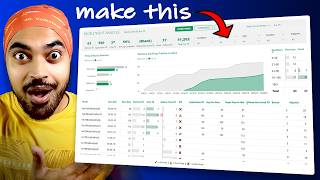
Innovative Data Viz Tips u0026 Tricks for Power BI 📊

Join Greg in this insightful session, where attendees will uncover outstanding techniques for enhancing interactivity, visual appeal, and navigation in Power BI reports. Greg will share expert tips on leveraging buttons, tooltips, and mapping strategies to elevate your reports. Participants will learn innovative ways to engage users, explore data dynamically, and enhance their reporting insights.
Key highlights of the session include:
Using buttons for intuitive navigation paths and interactive filtering
Implementing engaging tooltips for detailed data exploration and context
Enhancing geographical insights through mapping techniques and visualizations
Download the student files for this course:
https://prag.works/datavizstudentf...
Get your certificate of completion:
✔ https://prag.works/powerbidataviz...
Create a free community account on OnDemand Learning:
https://prag.works/powerbidataviz...
By the end of the session, attendees will have gained practical insights into creating more interactive and visually appealing Power BI reports using these advanced techniques.
Don't miss out on this opportunity to transform your reports with Greg's guidance on maximizing interactivity, employing advanced visual tricks, and enhancing geographical understanding effectively!
0:00 Introduction and overview
5:40 Power BI cheat sheet
6:22 Importance of diverse visualizations
10:07 Accessibility and universal design in Power BI
11:16 Building effective line charts
15:36 Adjusting visualization formats
22:13 Storytelling with data
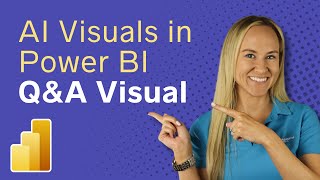
25:30 Introduction to Q&A feature
31:13 Additional AI features in Power BI
38:50 Forecasting in Power BI
45:24 Utilizing anomaly detection
51:25 Analyzing detected anomalies
56:47 Tooltips and advanced tricks
1:12:19 Tree maps
1:15:42 Making images into buttons
1:18:51 Designing reports for user engagement
1:22:00 Implementing drill throughs
1:24:45 Summary and closing remarks
#powerbi #datavisualization #dataanalysis
![Build Your First Canvas Power Apps Tutorial [HandsOn Course]](https://i.ytimg.com/vi/PEM5f9Xvn4g/mqdefault.jpg)

![Visual Calculations in Power BI DAX Made Easy! [Full Course]](https://i.ytimg.com/vi/JITM2iW2uLQ/mqdefault.jpg)


![Microsoft Fabric and Power BI Developer of the Future⚡ [Full Course]](https://i.ytimg.com/vi/ohKpl80obzU/mqdefault.jpg)


![Power BI Data Storytelling Training [Full Course]](https://i.ytimg.com/vi/SvVucB-oISo/mqdefault.jpg)