Monitoring Vegetation Health u0026 Stress with Vegetation Condition Index (VCI) Using Google Earth Engin

Understanding Vegetation Health: Mapping Vegetation Condition Index (VCI) in Lahore & Chichawatni, Pakistan:
Variable Initialization:
HandsomePakistani:
An object containing visualization parameters for the VCI (Vegetation Condition Index) layer, including bands, opacity, and palette.
LearnGeographyGISrsWithAI:
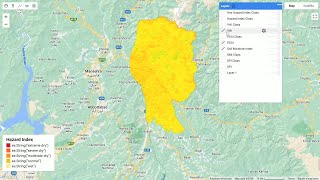
A variable storing a FeatureCollection representing the area of interest (AOI) shapefile for Lahore, Pakistan.
modisgeographywithai:
An ImageCollection containing MODIS NDVI data.
ScaledMD:
An ImageCollection obtained by mapping a function to divide NDVI values by 10,000, representing the scaling factor used for MODIS NDVI values.
NDVI Visualization:
Filtering MODIS NDVI images for a specific month using ee.Filter.calendarRange().
Calculating the maximum and minimum NDVI values for the selected month.
Adding NDVI layers to the map with a specified palette using Map.addLayer().
VCI Calculation:
Filtering MODIS NDVI images for a specific year and month.
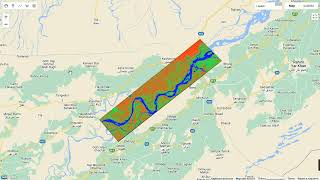
Computing the VCI by subtracting the minimum NDVI from the NDVI for a given year and month, then dividing by the difference between the maximum and minimum NDVI.
Determining the minimum and maximum values for VCI visualization.
Updating visualization parameters for VCI layer with auto adjustments.
Adding the VCI layer to the map using Map.addLayer().
Function for VCI Calculation:
Defining a function VCI_PakistaniGeographerfunc() to calculate VCI for each image in the ImageCollection.
Filtering MODIS NDVI images for a specific month inside the function.
Computing NDVI minimum and maximum values.
Calculating VCI and renaming the band.
Copying properties from the original image to the VCI image.
Adding Legend and Title:
Creating a legend panel to display VCI color representation.
Adding legend items for different VCI levels.
Adding the legend panel to the map.
Setting a title for the map.
Scale Bar:
Defining a function updateScaleBar() to update the scale bar text.
Calling the updateScaleBar() function when the map is clicked.
Creating a scale bar panel.
Adding a scale bar label to the panel.
Adding the scale bar panel to the map.
Extra Part (Chart and Console Output):
Creating a chart for NDVI over time using ui.Chart.image.series().
Printing NDVI and VCI values to the console.
Each part of the code contributes to visualizing and analyzing MODIS NDVI data, calculating the VCI, and presenting the results on the map with a legend, title, and scale bar. Additionally, it provides options for further analysis through chart visualization and console output.