NASA | Perpetual Ocean

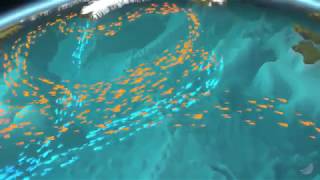
This visualization shows ocean surface currents around the world during the period from June 2005 through Decemeber 2007. The visualization does not include a narration or annotations; the goal was to use ocean flow data to create a simple, visceral experience.
This visualization was produced using NASA/JPL's computational model called Estimating the Circulation and Climate of the Ocean, Phase II or ECCO2.. ECCO2 is high resolution model of the global ocean and seaice. ECCO2 attempts to model the oceans and sea ice to increasingly accurate resolutions that begin to resolve ocean eddies and other narrowcurrent systems which transport heat and carbon in the oceans.The ECCO2 model simulates ocean flows at all depths, but only surface flows are used in this visualization. The dark patterns under the ocean represent the undersea bathymetry. Topographic land exaggeration is 20x and bathymetric exaggeration is 40x.
This video is public domain and can be downloaded at: http://svs.gsfc.nasa.gov/vis/a000000/...
Like our videos? Subscribe to NASA's Goddard Shorts HD podcast:
http://svs.gsfc.nasa.gov/vis/iTunes/f...
Or find NASA Goddard Space Flight Center on Facebook:
/ nasa.gsfc
Or find us on Twitter:
/ nasagoddard


![[4k]Sea Level Rise and Fall Simulation World](https://i.ytimg.com/vi/q87mUl13s-s/mqdefault.jpg)