NDVI map from Landsat 8 in arcgis | Land cover mapping

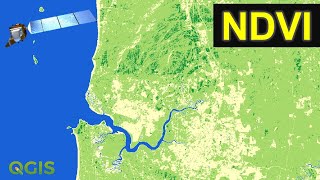
Hello everyone, welcome to today's tutorial on creating NDVI maps from Landsat 8 data in ArcGIS. NDVI stands for normalized difference vegetation index, and it is a commonly used metric for assessing plant health and vegetation density. In this tutorial, we will go over the steps to create an NDVI map using Landsat 8 satellite imagery in ArcGIS. So let's dive in!
Elevate your geospatial analysis skills with our indepth tutorial: "NDVI Map from Landsat 8 in ArcGIS | NDVI Ranges Explained." Uncover the secrets of extracting invaluable insights from Landsat 8 imagery through precise NDVI calculations using ArcGIS. This stepbystep guide covers essential aspects like band selection, NDVI formula application, and the nuanced interpretation of resulting NDVI ranges. Learn how to harness the power of remote sensing to assess vegetation health, monitor crops, and conduct comprehensive environmental studies. Our tutorial delves into advanced techniques, ensuring you master the intricacies of NDVI mapping. Whether you're a GIS professional or an enthusiast, this video provides a wealth of knowledge, delivering expert tips to optimize your geospatial analyses. Stay ahead in the field of GIS and remote sensing – hit subscribe now to stay updated with our latest tutorials, packed with actionable insights and industryrelevant keywords to boost your proficiency
Step 1: Acquiring Landsat 8 imagery
The first step is to acquire Landsat 8 imagery. Landsat 8 is a satellite that captures images of the Earth's surface in different spectral bands, including the nearinfrared and red bands, which are used to calculate NDVI. You can download Landsat 8 imagery for free from the USGS website or through the ArcGIS online portal. Once you have downloaded the imagery, open ArcGIS and add the imagery to your project.
Step 2: Calculating NDVI
Next, we need to calculate NDVI using the Landsat 8 imagery. To do this, go to the Spatial Analyst toolbar and select "Raster Calculator". In the expression box, enter the formula (NIRRED)/(NIR+RED), where NIR is the nearinfrared band and RED is the red band. This formula will give us the NDVI values for each pixel in the image.
Ranges of ndvi:
1 to 0 is for water of snow
0 to 0.18 bare land
0.18 to 0.27 grassy land
0.27 to 0.36 sparse vegetation
0.36 to 1 dense , healthy , tropical
#NDVI #Landsat8 #ArcGIS #RemoteSensing #GISAnalysis #Geospatial #SatelliteImagery #VegetationHealth #CropMonitoring #EnvironmentalAssessment #GISTutorial #DataAnalysis #SpatialAnalysis #GISMapping #GeospatialIntelligence #GISEducation #DataScience #RemoteSensingTutorial #SpatialData #MappingSkills #GISInsights #EarthObservation #GISProfessional #PrecisionAgriculture #GISCommunity #GeospatialTechnology #SpatialAnalysisTutorial #GISExperts #YouTubeTutorial


![The moment we stopped understanding AI [AlexNet]](https://i.ytimg.com/vi/UZDiGooFs54/mqdefault.jpg)