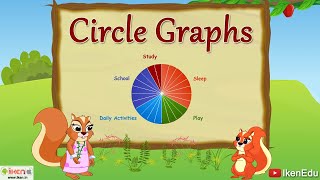
Pie Chart For Kids | Math Graphs | Grade 4 u0026 5 | Tutway

A data chart is a type of diagram or graph, where data is represented by various symbols such as bars in the bar graph, lines in the line graph or slices in the pie chart. Charts make it easy to understand large quantities of data and the relationship between parts of data. Data given in the form of charts is read more quickly. There are different types of charts. This video will make children learn what are pie charts and some basics about it.
Welcome to Tutway, a unique platform where learning is fun !
Now there is no distinction between kids' fun time and study time. Say goodbye to the days of cramming those dull and ponderous books, which made learning a tedious task. We believe in the straightforward idea that audiovisual learning is the most effective tool for learning. Many researchers have proven that kids learn a lot by playing interactive games and watching audiovisual animated lessons compared to reading from books. To understand the new concepts, Kids show more interest in adopting unique ways of learning. We have brought a programme that covers the crucial ideas and makes learning more stable that stimulates the critical thinking of the young learners !
Let's break away from our perception that adopting new learning concepts is challenging. You will find our website & youtube channel very userfriendly and interactive to gain knowledge. Even kids can access the content without constant parental supervision !
Site: https://www.tutway.com/
Email: [email protected]
Facebook: / tutway