Get real, active and permanent YouTube subscribers

Plas.io - A free online LiDAR data viewer/analyser

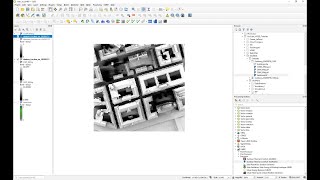
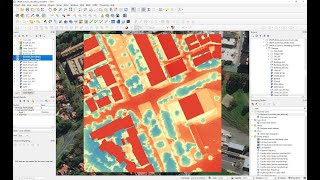
In this video, I will show you how to explore and visualise LiDAR point cloud datasets using the free online Plas.io viewer developed at MIT. I will also use the 'inundation' tool to identify potential areas that might be affected by flooding or sea level rise (in case of coastal areas).
This video was created as part of the Remote Learning Pathway activities for students of LARCH7031 Extreme Territories Studio School of Architecture and Built Environment. University of Adelaide: More info: https://bartesaghikoc.wixsite.com/aca...
Acknowledgements: The data used in this video was derived from LiDAR point clouds kindly provided by Aerometrex for teaching purposes.


![The moment we stopped understanding AI [AlexNet]](https://i.ytimg.com/vi/UZDiGooFs54/mqdefault.jpg)


Recommended