Plotting X Y Coordinates (Longitude Latitude) on a Map using Microsoft Excel

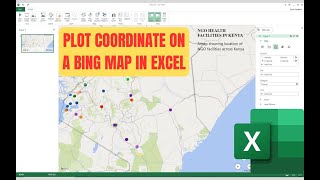
In this video, you will learn how to plot a simple dataset which consists of longitude and latitude coordinates on a map using Microsoft Excel’s 3D maps tool.
Typically, we use dedicated GIS software packages and tools such as ArcGIS, QGIS & Google Earth Pro to import x,y coordinates to visualize the point locations on a map. However, with Microsoft Excel’s fantastic mapping capabilities which is powered by Bing Maps, we are able to all of that just within Microsoft Excel itself.
Not only it provides the functionalities to plot the x,y data/ longitude, latitude data effortlessly on a map, bt it also provide advanced interactive styling and map formatting options to display data labels as you hower you mouse pointer over the point locations, along with advanced categorization capabilities where you can categorize your points dataset to display in different colors depending on a specific characteristics or a field value.
#3dmaps #microsoftexcel #geodeltalabs