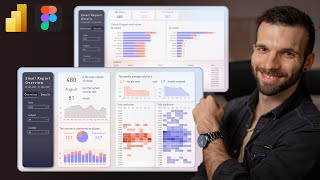
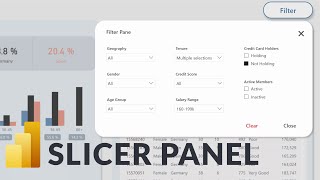
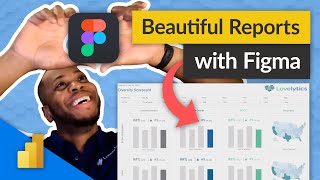
Power BI bar chart gets a gradient touch with Figma

In this video I show how to make a gradient bar chart design in Power BI. I use Figma for the design template.
You can download the files from my Google Drive here:
https://drive.google.com/drive/folder...
Instagram: / yourownkpi
Since many of you asked how I learn Power BI, here are some books I vouch for. I like to learn from books, because they provide a complete structure and they answer many questions I didn't even know I need to ask (not only as a beginner). I didn't read all of them form cover to cover yet but they gave me great value already nonetheless.
Amazon links to the books*:
Data visualization
● Storytelling with Data https://amzn.to/3RDAh1J
It is my #1 recommendation. If you don't read anything else, just read this and you will be ahead of the majority of the Power BI developers in dataviz.
● The Big Book of Dashboards https://amzn.to/3PGU3XJ
It is another great book and ithas many use cases if you want to dive deeper.
DAX
● Supercharge Power BI https://amzn.to/3Pw179u
A great book for beginners, covers the most crucial DAX topics.
● The Definitive Guide to DAX https://amzn.to/3rAgGF7
The holy book of DAX, but more advanced.
Power Query & Data Modeling
● Master Your Data with Power Query https://amzn.to/3ZJWFZy
This book gets you started very quickly with Power Query and ETL.
● The Data Warehouse Toolkit https://amzn.to/3thz7Py
Data modelling is so important. Better data model = simple DAX and faster reports! Read the first 2 chapters to get the basics. Dive eeper into specific chapters later on.
*These are Amazon affiliate links which provide a small commission to this channel via anything purchased via these links.
Timestamps:
00:00 Intro
00:17 Data preparation in Power BI
04:05 Design in Figma
17:34 Putting it together
25:44 Finished visual & outro
#yourownkpi #yokpi