Grow your YouTube views, likes and subscribers for free

Power BI Tachometer Custom Visual | Charts with Targets | Compare sales number with targets

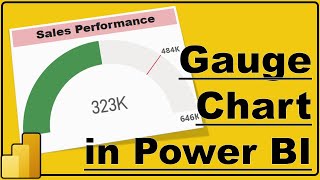
This is a short video explaining about Tachometer which is a custom visual.
If you want to improve visual story telling technique and make it effective, then this one visual is something which you should look for.
With the tachometer , you can split the chart into 3 categories and apply target. This is especially useful if you want to present the sales number and compare with targets.


Recommended