Power BI visuals tutorial for Beginners - Visualisation

If you are a beginner learning Power BI here's a tutorial on how to create visuals in Power BI along with links to other useful relevant content.
⏬Download the Excel source file and my demo Power BI File
https://aasolutions.sharepoint.com/:f...
▶ Check out this playlist for the videos I mentioned
• Getting Started with…
▶ For SharePoint and OneDrive videos I have this playlist:
• Power Query and SharePoint / OneDrive
▶ DAX and the Data Model including SUMX
• DAX & The Data Model
⭐ General Tips
Keep it simple
3 colours and use consistently to mean the same thing
remove clutter
use lines and white space to group visuals
flag insights
Sections
00:00 Introduction
00:17 The plan for the tutorial
00:43 Before we start
01:30 Recommended settings
03:30 Pulling Data from Excel using Power Query
07:02 Building a report
07:45 Always use Measures
12:47 Adding data bars to a visual
13:40 Consistency in colour
15:05 Add context with Prior Year comparison
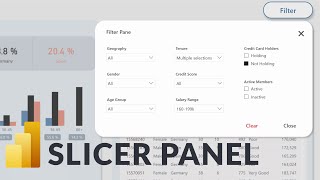
16:20 Adding a Slicer
18:58 Using Title and Subtitle in place of legend
19:30 Small multiples instead of stacked columns
24:50 Edit interactions to filter rather than highlight
27:16 Card Reference Labels
28:00 Avoid Pie Charts
The team and I at Access Analytic develop Power BI and Excel solutions for clients in Australia and deliver training around the World. https://accessanalytic.com.au/
Did you know I've written a book "Power BI for the Excel Analyst"?
https://pbi.guide/book/
Connect with me
https://wyn.bio.link/