Progress Circle Chart in Excel - Part 1 of 2

Sign up for our Excel webinar, times added weekly: https://www.excelcampus.com/blueprint...
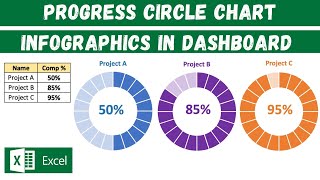
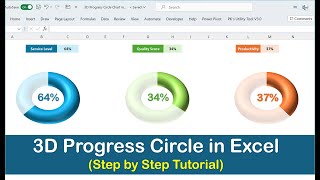
The progress circle (doughnut) chart displays the percentage of completion on a single metric. This is a simple chart that can be used in dashboards to show the progress towards a goal or target. It's basically a progress bar chart in the shape of a circle or doughnut.
DOWNLOAD the file: https://www.excelcampus.com/charts/pr...
In this first video, we look at how to create the progress doughnut chart in Excel. It is a simple chart that just requires 1 doughnut chart and a formula.
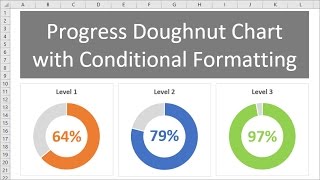
In part 2 of the video series, I explain how to apply conditional formatting to the chart so the color of the bar changes as the progress level changes.
Watch Part 2 • Progress Circle Chart with Conditiona...
FREE video series on Pivot Table & Dashboards: • Introduction to Pivot Tables, Charts,...
![How to Instantly Improve Your Excel Charts [Watch This!]](https://i.ytimg.com/vi/TqBYfMxVTc4/mqdefault.jpg)


![Doughnut Chart for Excel Dashboards: Simple and Easy way! [Excel Free Template]](https://i.ytimg.com/vi/PcnLu4yzH_Q/mqdefault.jpg)