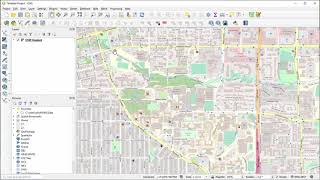
QGIS Choropleth Maps
In this QGIS tutorial we will go over how to create choropleth maps with shapefiles, how to convert a data type, how to join data files (csv) to a shape file, and at the end there is a list of resources to find map layers (shapefiles, etc.).
We go over an example of how to change a data type (from string to integer). In the specific example shown, changing the data type may not be needed however from time to time, changing data types may be necessary. You can change a data type in the source, in a spreadsheet or csv for example, or you can change the data type in QGIS in the attribute table. Also, from time to time when converting data to csv format, the output does not always turn out as expected. A good practice is to view the csv in a text editor such as Atom to make sure the data types, etc. look correct. If the data column that will be used for the choropleth map values comes in as a string, it may need to be converted to a number. For example, if after clicking on Symbology, Graduated, Value, you don't see the value listed, make sure the value is a number and not a string in the attribute table.
You might notice the choropleth map class value range breaks overlap which makes it hard to tell exactly which value range a geographic area fits into. A work around you can try is to uncheck link class boundaries, and double check the value ranges and change them manually. You can also highlight the legend values and change them manually.


![Power BI Dataflows Tutorial and Best Practices [Full Course]](https://i.ytimg.com/vi/GuU6_cqu8FE/mqdefault.jpg)