Free views, likes and subscribers at YouTube. Now!

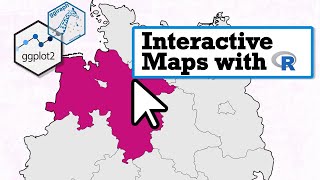
R tutorial: Creating Maps and mapping data with ggplot2

This video shows you how you can simply create country maps in R and then colour code countries according to some data, in this case % of the population having received a covid vaccine. I'll show you how you can alter the map properties and even put your own logo on the map.
Data and code used in the video can be found here https://drive.google.com/drive/folder...
Why not try the street map video too? • R Tutorial: Creating Street maps (par...


Recommended