Rating Meter Chart in Excel || Five Performance Buckets || Show Process or Portfolio Health

#RatingMeterChart #PerformanceRatingVisual #PortfolioHealthChart
Hello Friends,
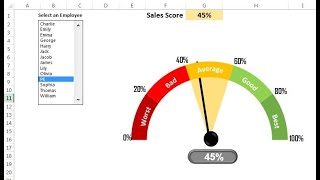
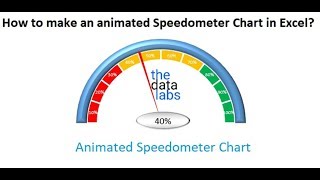
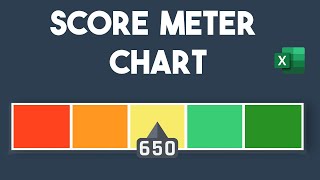
In this video you will learn how to create a beautiful and Innovative Rating meter chart to show the Process or Portfolio level health in five buckets – Worst, Bed, Average, Good and Best.
Please download this excel file from below given link:
https://www.pkanexcelexpert.com/rati...
See our Excel Products:
https://www.pkanexcelexpert.com/prod...
Visit to learn more:
Chart and Visualizations: https://www.pkanexcelexpert.com/cate...
VBA Course: https://www.pkanexcelexpert.com/vba/
Download useful Templates: https://www.pkanexcelexpert.com/cate...
Dashboards: https://www.pkanexcelexpert.com/exce...
Watch the best infographics and dynamic charts from below link:
• Dynamic Graphs
Learn and free download best excel Dashboard template:
• Excel Dashboards
Learn Step by Step VBA:
• VBA Tutorial
Website:
https://www.PKAnExcelExpert.com
Facebook:
/ pkanexcelexpert
Telegram:
https://t.me/joinchat/AAAAAE2OnviiEk5...
Twitter:
/ priyendra_kumar
Pinterest:
/ pkanexcelexpert
Send me your queries on telegram:
@PKanExcelExpert