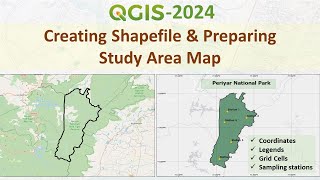
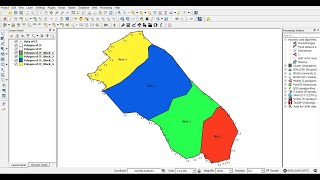
Sample Plots Design and Plotting in QGIS Forest

In this task, we will do how to generate a sample plots (regularly spaced points.)
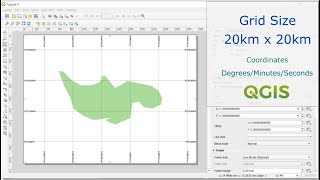
1. Add your Vector polygon layer to screen/canvas (spacing between the point to point should be preidentified by user.)
2. Goto Vector toolbar and click on Research Tools;
a. Regular points or Random points or
b. as you need there are several algorithms.
3. Provide the vector layer as the input layer,
4. Then fill the required fields, and get the generated points as your inputs.
5. Clipping of generated points is an easy task;
a. Vector toolbar Geoprocessing tools Clip
6. Calculate the serial number, XCoordinate and YCoordinate of clipped points and finally save the calculated attribute table as Excel (*.xls) as shown on the video.
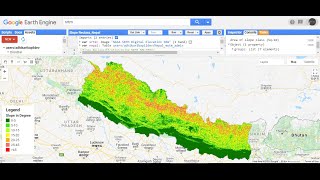
7. If you want to add Basemap on Canvas, then get the open source contributed Basemap from hundreds of Mapsites like; ESRI, BING, GOOGLE, LANDSAT, NASA, MapInfo, OSM,......, etc.
8. Now you can view and verify your Generated points live on canvas.
Thanks.
@Kapildev Adhikari