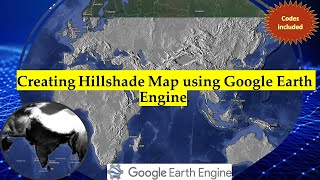
Spatio-temporal Analysis of NO2 Concentration using Google Earth Engine | Time Series Chart

In this video tutorial you will learn how to calculate NO2 Concentration using Google Earth Engine. By following the steps you can Visualize and perform Qualitative Analysis using Time Series Chart.
Codes for the Tutorial: https://code.earthengine.google.co.in...
Join this channel to get access to perks:
/ @terraspatial
NO2 (nitrogen dioxide) column number density refers to the concentration of NO2 molecules present in a vertical column of the Earth's atmosphere. It is typically measured in units of molecules per square meter (mol/m²) or micrograms per square meter (μg/m²).
NO2 is a reddishbrown gas that is primarily produced through combustion processes, particularly the burning of fossil fuels. It is a significant air pollutant and a key component of smog. Monitoring and measuring the column number density of NO2 helps assess air quality, understand pollution sources, and evaluate the effectiveness of emission control measures.
Satellitebased instruments, such as those onboard the NASA Aura and ESA Sentinel5 missions, use remote sensing techniques to measure the vertical column densities of NO2 across large geographic areas. These measurements provide valuable information about the distribution of NO2 and its variations over time. NO2 column number density data can be used to analyze trends, identify pollution hotspots, study the impact of emissions on human health and the environment, and inform policy decisions aimed at reducing air pollution.
The ee.ImageCollection('COPERNICUS/S5P/NRTI/L3_NO2') is an Earth Engine Image Collection that represents a collection of images related to nitrogen dioxide (NO2) measurements from the Copernicus Sentinel5P satellite's NearRealTime (NRT) Level 3 product. The Copernicus Sentinel5P satellite is part of the European Union's Copernicus program, which aims to provide accurate and uptodate Earth observation data for environmental monitoring and policy support. The satellite carries the TROPOMI (Tropospheric Monitoring Instrument) sensor, which is specifically designed to measure atmospheric composition.
The Level 3 NO2 product combines data from multiple satellite overpasses to create composite images with global coverage. These composite images typically represent average values over a specific time period, such as daily, monthly, or annual averages. The NRT aspect indicates that the data is processed and made available as soon as possible, allowing for nearrealtime monitoring of NO2 levels. Each image in the ee.ImageCollection('COPERNICUS/S5P/NRTI/L3_NO2') collection represents a snapshot of the NO2 column number density, providing information about the spatial distribution and temporal variations of NO2 concentrations in the atmosphere. The collection includes a time series of these images, allowing for analysis of changes in NO2 levels over time.
Using Earth Engine, you can access the ee.ImageCollection('COPERNICUS/S5P/NRTI/L3_NO2') and apply various geospatial operations and analyses to extract meaningful insights. This can include filtering the collection by date, region, or other criteria, calculating statistics, visualizing the data, and performing temporal analyses to study trends or detect anomalies in NO2 levels. The availability of this image collection offers a valuable resource for scientists, researchers, policymakers, and other stakeholders interested in studying air quality, monitoring pollution sources, assessing the impact of emissions, and understanding the dynamics of NO2 in the Earth's atmosphere.
#googleearthengine #NO2 #concentration #airquality #analysis #remotesensing