Splunk create a dashboard from a search or report utilizing the Trellis Layout.

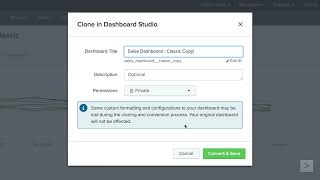
In this video I will go over how to create a dashboard from a search or report within Splunk. First, I will start by creating a Classic (Simple XML) dashboard and then using the same search to recreate the dashboard in Dashboard Studio. I will also highlight a difference between Classic/Studio when dealing with the Trellis Layout for line/area visualization.
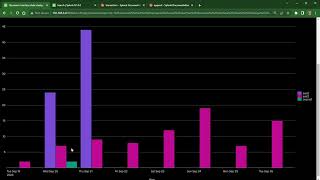
Once in Dashboard Studio I will replicate the Trellis Layout found in the Classic dashboard and then make adjustments to fit your needs. You will see 2 methods for populating each of the 4 panels in the dashboard. The first method will utilize having a base search with a chain search for each panel. The second method is a trick I learned where you have 1 primary search and then select the fields you want to display under Configuration Data configurations Y for a line/area visualization. Both methods only require 1 search, but the second does not require the creation of chain searches which can save time.
For anyone interested here is search I was using:
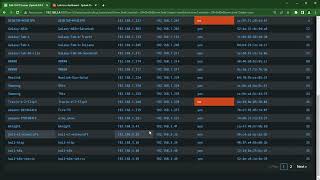
index=speedtest
| stats avg(eval(round('download.bandwidth'/1024000*8,2))) as down avg(eval(round('upload.bandwidth'/1024000*8,2))) as up avg(eval(round('ping.latency',2))) as latency avg(eval(round('ping.jitter',2))) as jitter by _time
| sort _time
Splunk documentation links:
Intro to Classic Dashboards:
https://docs.splunk.com/Documentation...
Intro to Dashboard Studio:
https://docs.splunk.com/Documentation...