Secret sauce that brings YouTube followers, views, likes

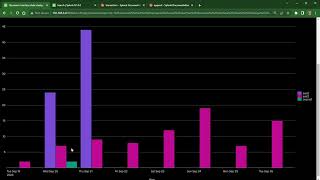
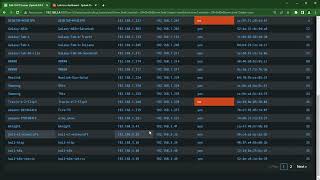
Splunk Dashboard Studio Pie chart and Table visualization color customization options

This video will demonstrate additional options that can only be set in the source editor for both the Pie chart and Table visualizations while using Dashboard Studio. Additional options are not limited to visualizations that are used in the video and would recommend diving into the visualization that you want to use further.
Splunk documentation links:
Splunk Dashboard Studio Pie chart:
https://docs.splunk.com/Documentation...
Splunk Dashboard Studio Table:
https://docs.splunk.com/Documentation...
Modify and write dynamic options syntax:
https://docs.splunk.com/Documentation...


Recommended