STATISTICS::MODE GRAPHICALLY::MEAN MODE MEDIAN RELATIONSHIP

Lecture 8. MODE GRAPHICALLY | MEAN MEDIAN MODE RELATIONSHIP
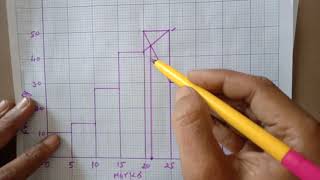
Caption: The mode in statistics is the most frequently occurring value in a dataset, which can be easily represented graphically as the highest bar in a histogram or bar chart. The mean and median are other measures of central tendency, and their relationship with the mode can provide insights into the shape and symmetry of a data distribution.
Keywords: statistics, mode, frequently occurring value, dataset, graphical representation, histogram, bar chart, mean, median, central tendency, symmetry, skewed distribution, data distribution.
1. INTRODUCTION • Business Mathematics and Statistics B...
2. MEASURE OF CENTRAL TENDENCY • BUSINESS STATISTICS:MEASURE OF CENTRA...
3. MEASURE OF CENTRAL TENDENCY (NUMERICALS) • Statistics Numerical Measure of Centr...
4. WEIGHTED MEAN • Statistics:: Weighted Mean
5. MEDIAN QUARTILE | PARTITION VALUES • STATISTICS MEDIAN QUARTILE PARTITION ...
6. PROBLEM SUMS NUMERICALS • STATISTICS PROBLEM SUMS NUMERICAL
7. OGIVE CURVE • OGIVE CURVE:: Statistics
8. MODE GRAPHICALLY | MEAN MEDIAN MODE RELATIONSHIP • STATISTICS::MODE GRAPHICALLY::MEAN MO...
9. MODE • STATISTICS :: MODE
10. MEASURE OF DISPERSION RANGE QUARTILE DEVIATION • Measure Of Dispersion Range Quartile ...
11. MEAN DEVIATION | STANDARD DEVIATION • Statistics Mean Deviation Standard De...
12. STANDARD DEVIATION COVARIANCE COMBINED STANDARD DEVIATION • Standard Deviation CoVariance Combine...
13. CORRELATION CONCEPT AND UNDERSTANDING PART 1 • Correlation:: Concept and understanding
14. CORRELATION NUMERICALS AND FORMULAS • Correlation Numericals and formulas
15. RANK CORRELATION • Rank Correlation
16. INDEX NUMBERS PART 1 • Index Numbers Part 1
17. INDEX NUMBERS PART 2 • Index Numbers Part 2
18. TIME SERIES PART 1 • Time Series Analysis
19. TIME SERIES PART 2 • Least Square Method
20. GEOMETRIC MEAN • Geometric Mean
21. HARMONIC MEAN • Harmonic Mean
Mode Graphically
Draw Ogive
Nitin Goel
Full Statistics Playlist
• Business Statistics XI and B.com Niti...