Step by Step Tutorial to Create Gantt Chart in Power BI using Deneb | MiTutorials

Welcome to our comprehensive tutorial on creating a dynamic Gantt Chart using the Deneb Visual in Power BI! Whether you're new to Gantt charts or looking to enhance your project management toolkit, this video is for you.
In this tutorial, we will cover:
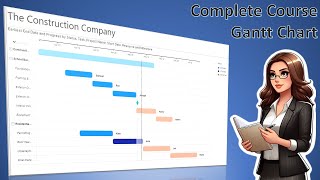
What is a Gantt Chart? Learn the basics and understand its importance in project management.
Full Feature Breakdown: Explore the powerful features of the Deneb Gantt Chart, including dynamic zooming, task dependencies, customizable colors, and more.
StepbyStep Guide: Follow along as we set up a Gantt Chart from scratch, customize its settings, and utilize advanced features to optimize your project tracking.
Github Link https://github.com/PBIDavid/DenebSh...
Download Dataset : https://1drv.ms/f/s!ArKvq35SpC2G7FUHo...
For Queries ✉ : [email protected]
0:00 00:55 Intro & What is Gantt Chart ?
0:56 5:30 How to Read the Gantt Chart
5:31 6:53 Github Resources
6:54 8:53 Understanding the Dataset
8:54 9:31 How to Install Deneb Visual
9:32 11:45 How to Create the Gantt Chart
11:46 12:16 Various Features
12:17 13:28 Multiple Dependencies Feature
13:29 15:30 Advanced Settings
15:31 16:42 Change Colors of the Visual