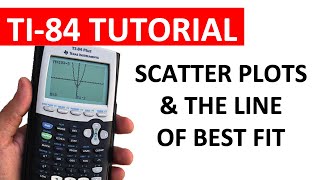
TI 84 How to use the StatPlot to graph scatter plots and regression lines

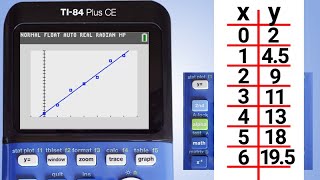
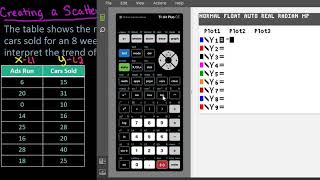
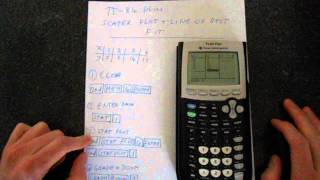
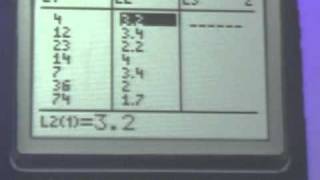
Here's how you can enter scatter plot data on the TI 84 calculator using the Stat Plot function and also graph the regression line on top of the scatter plot. I don't usually suggest using the Zoom function, but in this case the ZoomStat function will come in handy.
Check out my YouTube channel "Like a Math Class"
/ @likeamathclass
This affiliate link may earn us a commission
TI84 Plus CE Graphing Calculator https://amzn.to/3GuXk8I
#GDC #TI84 #StatPlot #ScatterPlots #CalculatorHelp #shorts
Legal Disclaimer: This video/channel is not affiliated with or sponsored by the International Baccalaureate. It is a channel based on my 10+ years of teaching IB SL Math. While I believe that with the right amount of time, effort and studying strategies, anyone has the potential to earn a 5 on their IB Analysis & Approaches Math exam, individual results may vary.