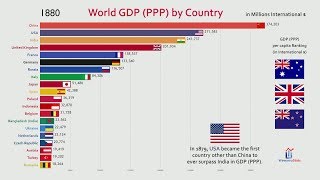
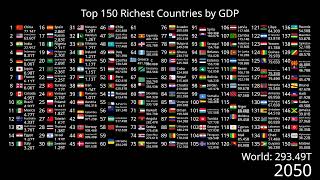
Top 15 Countries By GDP (1600-2019)

This video will compare the top 10 countries by gross domestic product. Gross domestic product, or GDP, is the monetary measure of the market value of all the final goods and services produced in a specific time period by countries. It is calculated using the formula: GDP = Consumption + Investment + Government Investment + (Exports Imports). This is the first iteration of the historical GDP series on this channel. I wanted to create a video that compared the top historical countries by GDP. Other videos on YouTube use modern borders for the entirety of the comparison, which is not historically accurate. But this video uses the historical empires (Mughal Empire, Qing Dynasty, Prussia, Empire of Japan, etc.) which makes it the most accurate. However, since this comparison goes back so far into the past, the numbers should only be take as an estimate as most historians don't even agree on a specific number.
*Update: Here is a more updated and accurate version of a GDP video:
• Top 10 Countries by GDP (18962022)
**I am the only person doing the animations, coding, and music/video editing, and I do not have a team of editors doing any work for me. On average, a video project takes me about a month to complete, but usually it takes much longer. This video in particular took me three months to complete since it goes back four centuries.
***My videos are created using a 5 step process:
The first step is finding the inspiration for an idea. This could come from current events, suggestions from viewers, or interesting data that I self curated.
The second step is the research. Before creating a topic for a video, research needs to be done to understand the topic in full, and why the numbers are what they are.
The third step is data collecting. I’ll research through historical texts, articles, and organization websites to create a dataset on the topic.
The fourth step is to animate the dataset. I use a variety of animation and coding softwares, such as Flourish, Power Bi, Excel 3D, Adobe After effects, Motion, and more.
The fifth and final step is to export the animation over to Final Cut Pro to cut, edit, and enliven the overall project. I’ll add images, additional information, and after effects to turn what was once a dataset of numbers into a colorful project.
Music: Egmont Overture by Beethoven Kevin Macleod
Egmont Overture by Kevin MacLeod is licensed under a Creative Commons Attribution 4.0 license. https://creativecommons.org/licenses/...
Source: http://incompetech.com/music/royalty...
Artist: http://incompetech.com/
Works Cited:
Matthews, Dylan, and Kavya Sukumar. “India Is as Rich as the US in 1881. A Mesmerizing Graphic Shows Where Every Country Falls.” Vox, 8 Oct. 2015, https://www.vox.com/2015/10/8/9474463....
Louis Johnston and Samuel H. Williamson, "The Annual Real and Nominal GDP for the United States, 1789 Present." Economic History Services, April 2002, URL : http://www.eh.net/hmit/gdp/.
Roser, Max, et al. “Military Spending.” Our World in Data, 2013, https://ourworldindata.org/militarys....
Wikipedia contributors. “Economic History of China (1912–1949).” Wikipedia, The Free Encyclopedia, 19 Apr. 2022, https://en.wikipedia.org/w/index.php?....
Nber.Org, https://www.nber.org/system/files/cha....


![Top 30 Largest Economies in 2030 [GDP nominal]](https://i.ytimg.com/vi/3McqKpa-caU/mqdefault.jpg)