t-tests and p values

Note: this video omits one part of the pvalue definition, which needs to be covered next after watching this video. The pvalue is the probability that the null hypothesis assigns to your observed difference *or more extreme differences*. For example, we can imagine the average height is known to be 1.7 meters in a give country. You wonder if a subpopulation in a specific geography is taller. So, you use a null hypothesis H0: average height = 1.7 meters. You draw a random sample and measure a sample average of x = 1.9 meters. You calculate a pvalue of p = 0.04, which means there's a 4% chance according to the null hypothesis of measuring a difference of 0.2 meters *or greater*. Symbolically, we represent this as P(X ≥ x | H0) where X is the sample statistic you are measuring (average height), x is the instantiation or actual value you've acquired in some particular sample, and "|" means "given" and H0 is the null hypothesis. All together, the last part means "given that we're assuming the null hypothesis to be true."
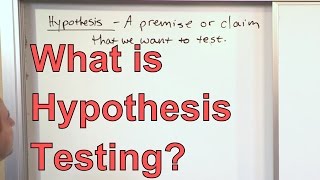
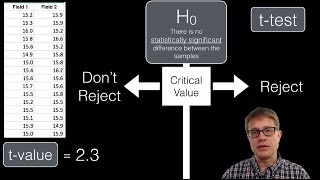
Intro: what is a pvalue? It's not the probability that the alternative hypothesis is true. It's also not the probability that the null hypothesis is true. The pvalue is how likely the null hypothesis thinks your DATA (or more extreme data) are. If the pvalue is less than 0.05, then the only way the null hypothesis can explain your dataset is by calling it an incredibly rare statistical fluctuation. In those circumstances, we decide that the null hypothesis is a bad assumption, and we reject the null hypothesis. Instead, we conclude that something else (a true difference in the population at large) must explain the observed difference in the sample.
After watching this video, there are some other things to study next:
The hypothesized null value is not always 0, as the example above shows.
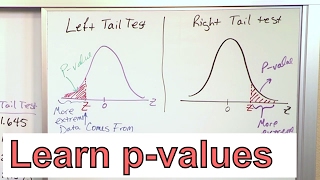
The ttest can be onesided (where you only consider more extreme differences on the same side of the distribution as your observed difference) or twosided (where you consider more extreme differences on both sides of the distribution as your observed difference)
[For statistics MS students:] you will learn that it's possible to have simple a null hypothesis based on a single value from the parameter space (such as H0: µ = 1.7 meters) or a composite null hypothesis (such as H0: µ ≤ 1.7 meters).