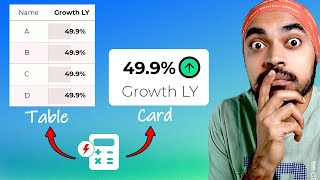
Use Measures as Columns Using Calculation Group in Power BI

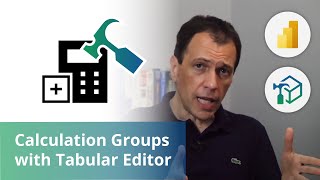
In this tutorial, you'll learn how to use measures as columns in Power BI by using calculation groups. We will create a highly customized table visualization with columns representing various measures. We used Tabular Editor, an external tool, to create and manage calculation groups in Power BI.
===== ONLINE COURSES =====
✔ Mastering DAX in Power BI
https://goodly.co.in/learndaxpowerbi/
✔ Power Query Course
https://goodly.co.in/learnpowerquery/
✔ Master Excel Step by Step
https://goodly.co.in/learnexcel/
✔ Business Intelligence Dashboards
https://goodly.co.in/learnexceldash...
===== LINKS =====
Blog https://www.goodly.co.in/blog/
Corporate Training https://www.goodly.co.in/training/
Need my help on a Project https://www.goodly.co.in/consulting/
Download File ⬇ https://goodly.co.in/howtousemeasu...
===== CONTACT =====
Twitter / chandeep2786
LinkedIn / chandeepchhabra
Email [email protected]
===== WHO AM I? =====
A lot of people think that my name is Goodly, it's NOT ;)
My name is Chandeep. Goodly is my fulltime venture where I share what I learn about Excel and Power BI.
Please browse around, you'd find a ton of interesting videos that I have created :) Cheers!