Get YouTube subscribers that watch and like your videos

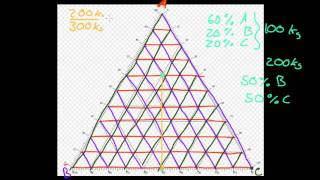
Using a ternary diagram

This video explains how to read or plot data on a special triangleshaped plot called a ternary diagram. Ternary diagrams are commonly used to represent the percent of sand, silt, and clay particles within a soil sample, for example. This video was created by Madison Culver in 2022, as part of the class "Soil, Water, and Weather" at Oklahoma State University. This video is used in the free etextbook "Rain or Shine: An Introduction to Soil Physical Properties and Processes" by Tyson E. Ochsner, available at: https://osf.io/z4rbt/.


Recommended