Using Drawing Tools in Excel 2007 2010 2013 2016 2019 and Office 365

Excel has drawing tools that you can use like Visio to create flow charts, value stream maps, fishbone diagrams and much more.
For more information, visit the following link: www.qimacros.com/freeexceltips/exceldrawingtoolbar/
www.qimacros.com/trial/30day/
Many people ask how to use Excel’s drawing tools.
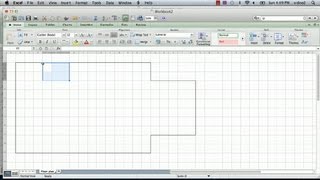
Excel has like a little mini Visio built right into it. So, you don't really need Visio or anything else exotic to draw most kinds of charts and things. If you click on the insert tab, you'll see that it allows you to put in pictures and clipart and things of that nature.
But here's all the various shapes that are available in Microsoft Excel and down here you can see there's things like flowcharts you can put in callouts. You can put in arrows, various basic shapes, and connecting devices here and here's all the things I've used most recently.
The easy thing to do here is let's just go grab from the flow chart we can get a box and just draw it on there and Excel will show you what that box looks like (and you can change the color as needed.)
Then, if you just start typing in there, this is step one, it'll actually put that in there. If you want to format that object a little bit, you might want to just rightclick on the border. There's lots of tools that come up when you just rightclick on a border here.
If you need to change this, all you have to do select on it and click one. Once you've got that, you can right click and choose copy and then, say I just want to paste that in here, I could get some more of them in here pretty quick. I can just paste drop various things in here.
Then, with our insert shapes, I might want to connect all of these so I could actually do an elbow arrow connector. I can just take that and draw it down here, from here to there, and then I might need another one of those and so I could actually there, copy or paste this one, or I could just insert another one so we have the ability to insert more of those.
Maybe I want to take this one, and I want this one to run over here and it'll connect to all that (the little tangential places on here), and then when I move it around, it all stays connected.
This is a very easy way to start to draw little simple charts and things.
Now, one of the things I use is the gridlines to lay everything out, but then once I’m done, we can go over to view and turn off the grid lines on this page, and now we have a nice clean looking page.
If we wanted to, we could put in a decision Diamond and again, we could change the colors on that and just connect all of the dots here.
It’s pretty easy to start to draw whatever kind of diagram you want. Sometimes we have things like charts and maybe I want to make an annotation on this chart, like an insert, and I can choose to insert some sort of box or some sort of text box (I use text boxes a lot). Process is stabled.
So, I might want to put some little special things on a chart. You can actually just stick things right on charts. You can stick them on worksheets and really start to make everything that you produce a lot more readable.
There’s very many kinds of things that you can draw in here: curly lines, square lines, flowcharts, etc.
If I wanted to, I could take and put a callout on here and simply attach that to a point and say process changed here or something like that.
These are the kinds of things that you can do quickly and easily and then you just redirect things around so that they sit where they’re supposed to sit.
I hope that gives you some ideas about how to start using Microsoft Excel’s drawing tools and again, you’ll see they’re just sitting up here with all the most recently used shapes.
We could just keep drawing easily whatever kind of thing comes into our mind and create that diagram that we’re going to need for various presentations and sometimes I find this is actually even easier than trying to do that in a PowerPoint presentation.
So, enjoy using the tools of Microsoft Excel to draw charts and diagrams and flowcharts and all the stuff that we need to display our ideas and get them across to other people.