Vegetation Drought Assessment Using SPI (Standardized Precipitation Index) using Google Earth Engine

https://drive.google.com/file/d/1vTzI...
The code first loads a specific area named "lowerpunjab" from a user's collection. This area is likely a region of interest for further analysis.
Then, it loads precipitation data from a collection named "UCSBCHG/CHIRPS/PENTAD" for the period 20172023. It selects the "precipitation" band, filters the data for the desired timeframe, calculates the mean precipitation, and clips it to the study area.
2. SPI Calculation Function:
A function named calculateSPI is defined to compute the Standardized Precipitation Index (SPI) for a given image.
Inside the function:
It calculates the mean and variance of precipitation data within the study area using reduceRegion with a combined reducer. This efficiently calculates both statistics simultaneously.
The function then calculates the shape and scale parameters of a Gamma distribution based on the mean and variance. SPI utilizes the Gamma distribution to model precipitation patterns.
Finally, it computes the SPI by subtracting the mean from the image, dividing by the square root of the mean, and renaming the result as "SPI."
3. SPI Analysis and Visualization:
The calculateSPI function is used to generate the SPI image for the loaded precipitation data.
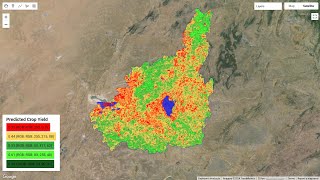
A visualization parameter object (spiVis) is defined to specify how the SPI image should be displayed on the map. It sets the minimum and maximum values to be visualized, and assigns a color palette for different SPI ranges.
The calculated SPI is then added as a layer to the map with the defined visualization parameters.
The minimum and maximum SPI values within the study area are printed using reduceRegion with a minMax reducer.
The map is centered on the study area for better visualization.
4. Legend Creation:
A legend panel is created to visually represent the different SPI classes and their corresponding colors.
The legend includes a title and multiple rows, each representing an SPI class.
A function makeRow is defined to create individual legend rows with colored boxes and descriptive labels for each SPI class.
The code defines class names (e.g., Very Dry, Wet) and their corresponding colors.
It iterates through these class definitions and uses the makeRow function to generate legend rows, which are then added to the legend panel.
Finally, the legend panel is added to the map for reference.
In summary, this code snippet calculates the SPI based on precipitation data for a specific region and visualizes it on a map with informative legends, allowing for analysis of drought conditions in the area.