Visualizing Data Using t-SNE

Google Tech Talk
June 24, 2013
(more info below)
Presented by Laurens van der Maaten, Delft University of Technology, The Netherlands
ABSTRACT
Visualization techniques are essential tools for every data scientist. Unfortunately, the majority of visualization techniques can only be used to inspect a limited number of variables of interest simultaneously. As a result, these techniques are not suitable for big data that is very highdimensional.
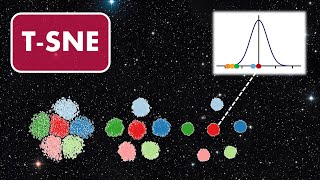
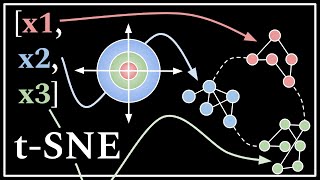
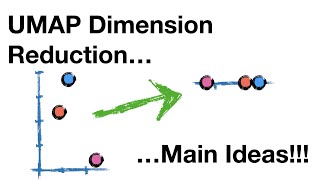
An effective way to visualize highdimensional data is to represent each data object by a twodimensional point in such a way that similar objects are represented by nearby points, and that dissimilar objects are represented by distant points. The resulting twodimensional points can be visualized in a scatter plot. This leads to a map of the data that reveals the underlying structure of the objects, such as the presence of clusters.
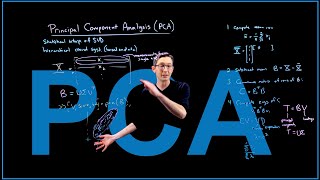
We present a new technique to embed highdimensional objects in a twodimensional map, called tDistributed Stochastic Neighbor Embedding (tSNE), that produces substantially better results than alternative techniques. We demonstrate the value of tSNE in domains such as computer vision and bioinformatics. In addition, we show how to scale up tSNE to big data sets with millions of objects, and we present an approach to visualize objects of which the similarities are nonmetric (such as semantic similarities).
This talk describes joint work with Geoffrey Hinton.