15 YouTube views, likes subscribers in 10 minutes. Free!

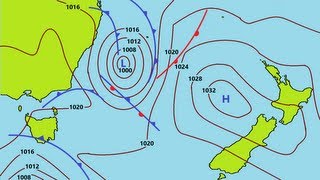
Visualizing Ocean Salinity (SMAP) as Powerful Storms (IMERG) Arrive in California

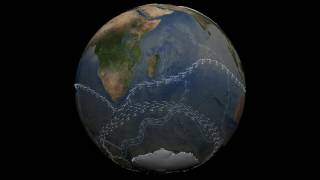
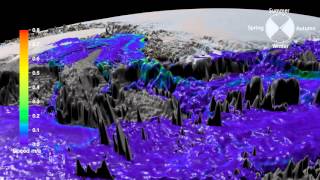
The animation shows the 8day sea surface salinity (SSS) anomalies from NASA’s SMAP satellite over the ocean and the daily satellitederived land precipitation rate over land from NASA’s IMERG, from December 26th, 2022 to January 16th, 2023. On the ocean side, the blue (red) colors correspond to lower (higher) salinity with respect to the December 26January 16 20152022 climatology, in response to higher (yellow color) precipitation over land, draining into the coastal ocean waters.


Recommended