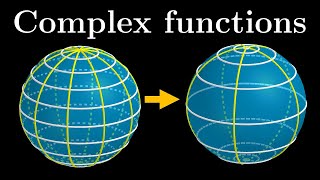
What does a complex function look like?

Join me as I explore the different ways we can visualize a complex function, to find which one deserves to be called their true graph.
=================================================
0:00 Quick introduction
0:30 Why can't we just plot a complex function?
1:45 Mapping between 2 planes
2:35 Grid mapping
3:07 Reading a grid map
4:15 The problem with grid mapping
5:35 Colors to the rescue!
7:07 Mapping hue and brightness
8:11 Contour maps
8:43 Domain coloring: z/(z^2 + 1)
10:07 Domain coloring + contour lines
10:40 Domain coloring: z^2
11:00 Domain coloring: e^z
12:05 Domain coloring: z^5 + z^2
12:30 Domain coloring: tan(z) and (z4i)/(z+4i)
13:20 Going 3D
14:50 |f(z)| + hue
16:20 What is a graph?
18:12 Projections and surfaces in 4D
18:53 Graphing Re(f(z))
19:45 Re(f(z)) + hue
=================================================
The bulk of the code I used can be found on github:
[https://github.com/mathematimpa/compl...]
CC atributions:
Contour map of Mt St Helens
Clarknova, CC BYSA 3.0 [https://creativecommons.org/licenses/...], via Wikimedia Commons